Quantify enrollment risk before launch with real patients,
not assumptions.


Looking for Patient Recruitment? Click here
The "Incentive" Gap
To a CRO, a "Dud" site still generates startup and management fees. To you, it’s a $60,000+ drain per site and a program-level timeline stall.
The "Historical" Trap
Traditional feasibility relies on over-optimistic site surveys and stale databases. It ignores real-time patient signals in the neighborhood.
The "Invisible" Variance
We consistently find 1.5x to 3x differences in enrollment liquidity between sites in with similar characteristics. Picking the wrong neighborhood is a choice you shouldn't have to make in the dark.
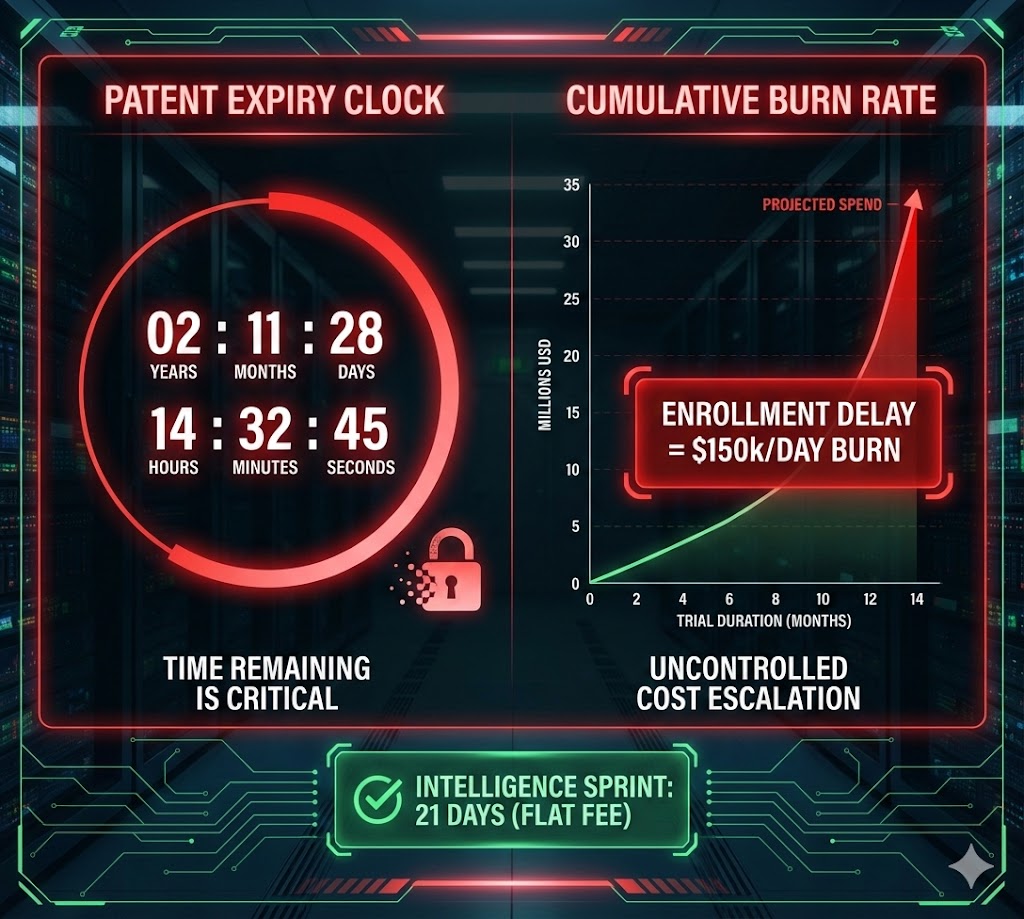
Estimates are free. Delays cost millions.
We serve as your Independent Truth Layer, providing the mathematical oversight needed to hold your CRO and your timeline accountable.

De-risk your trials via real-time feasibility signals generated before the first site is activated.
We bypass the "50-mile myth" to analyze the specific 5-15 mile catchments that actually drive patient behavior and travel patterns.
We reveal why Site A will outperform Site B in the same metro area, or why a counterintuitive mid-sized town will outperform major cities, allowing you to prioritize high-liquidity clusters.
Geography is not a constant. We test live liquidity against your specific study, proving that a "Rockstar" site for one indication can be a "Zero-Enroller" for another.
Discovery to delivery, we follow a proven framework that ensures clarity, precision, and growth.


$50,000+ per "dud" site
Months of enrollment delays
37% Under-enrollment rate
If we identify just 3 non/underenrolling sites, the audit has already paid for itself in saved activation waste.
Example 1: Early Warning of Low Demand for a Common Condition
Indication: Cardiology
Site 1: 180 Leads interested
Site 2: 28 Leads interested
Early demand signals revealed a substantial gap in patient interest between catchments.
Even with comparable outreach effort, limited real-time demand at Site B suggested heightened enrollment risk if activated.
Example 2: Population size alone can mislead site selection decisions.
Indication: CNS
Site 1: Southwest US, Population 200,000
Interested Leads: 50
Site 2: Mountain US, Population 110,000
Interested Leads: 119
With a smaller population base, live demand signals showed nearly 2.4× difference in patient interest — a distinction that static feasibility data would not surface early.
Example 3: Outsized Demand Reveals Expansion Opportunity
Indication: Dermatology
Site 1: 520 Interested leads
Site 2: 119 Interested leads
In similar areas, one catchment demonstrated 4.3x higher patient interest, suggesting not only lower enrollment risk, but potential opportunity for additional site expansion in high-demand regions.
These signals are not used to predict enrollment outcomes in isolation. They are used to flag relative demand strength, identify early risk, and guide site activation decisions before costs are locked in.
Avoid Launching A Dead-on-Arrival Site List
Answers to common questions about our platform and services.
Your Burn Rate is real...
Secure your clinical milestones today.